
Data Visualization Library
Interact with the data that tells the story of Hawaiʻi’s evolving workforce. From wages to industries to education outcomes, we’re building a library of data tools to inform decisions and empower action to meet Hawaiʻi’s Generational Workforce Commitment.
Search by keyword or browse below.
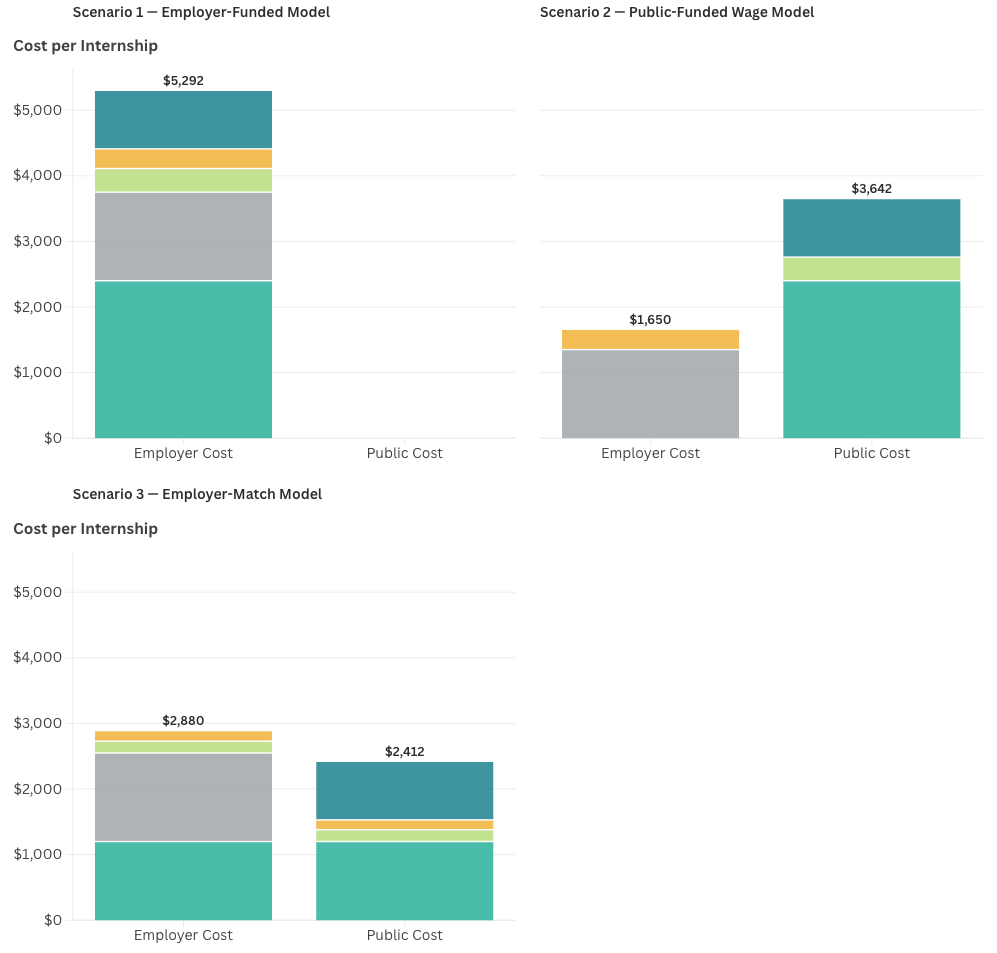
How does the cost of one high-quality internship shift between employers and public funders under three different funding scenarios?
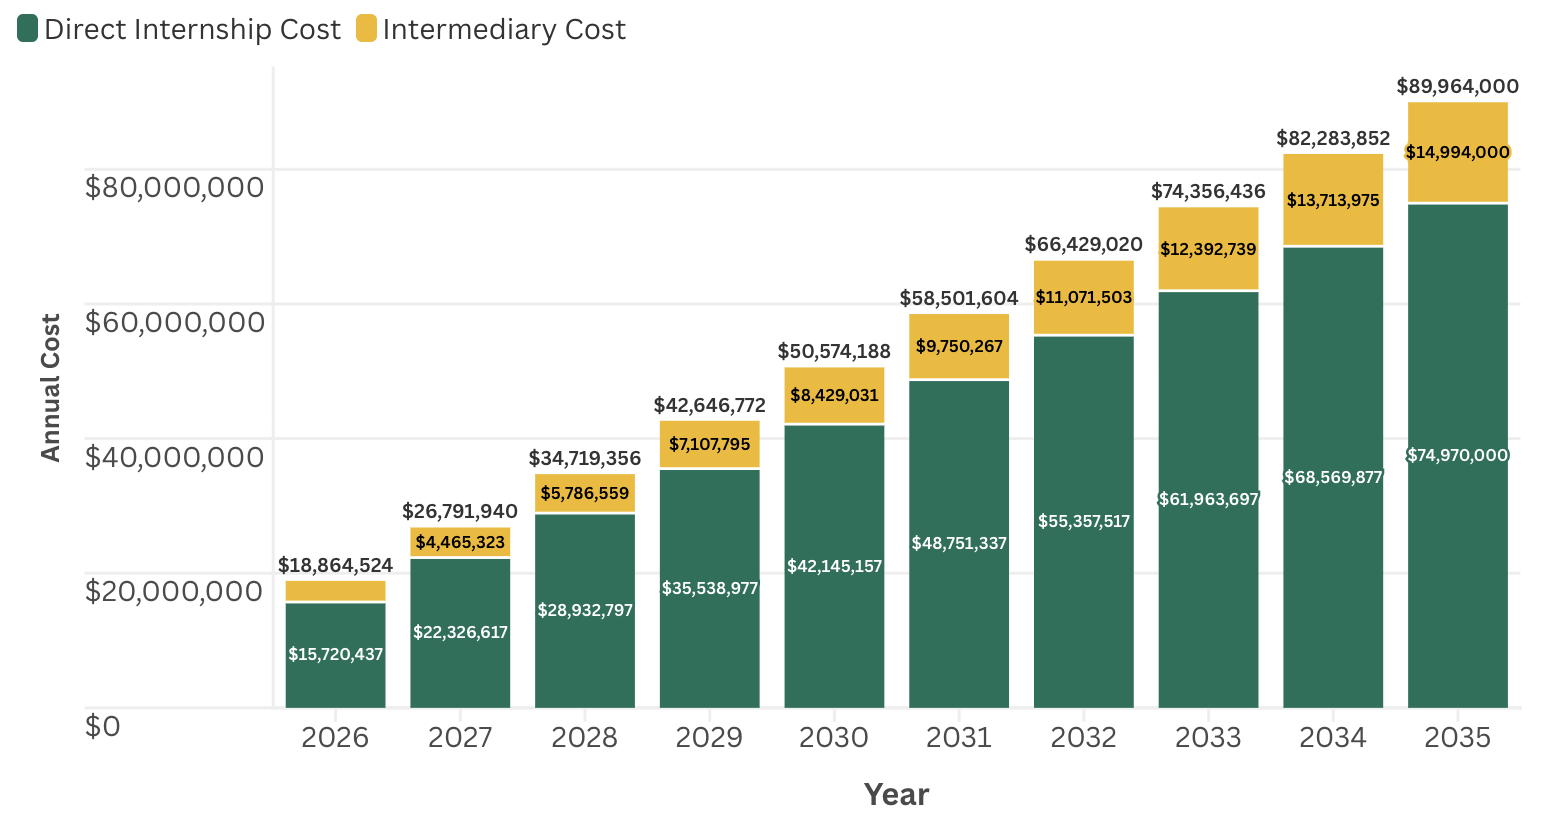
What would the full annual cost of scaling paid pathways look like when intermediary infrastructure is included alongside direct internship expenses?
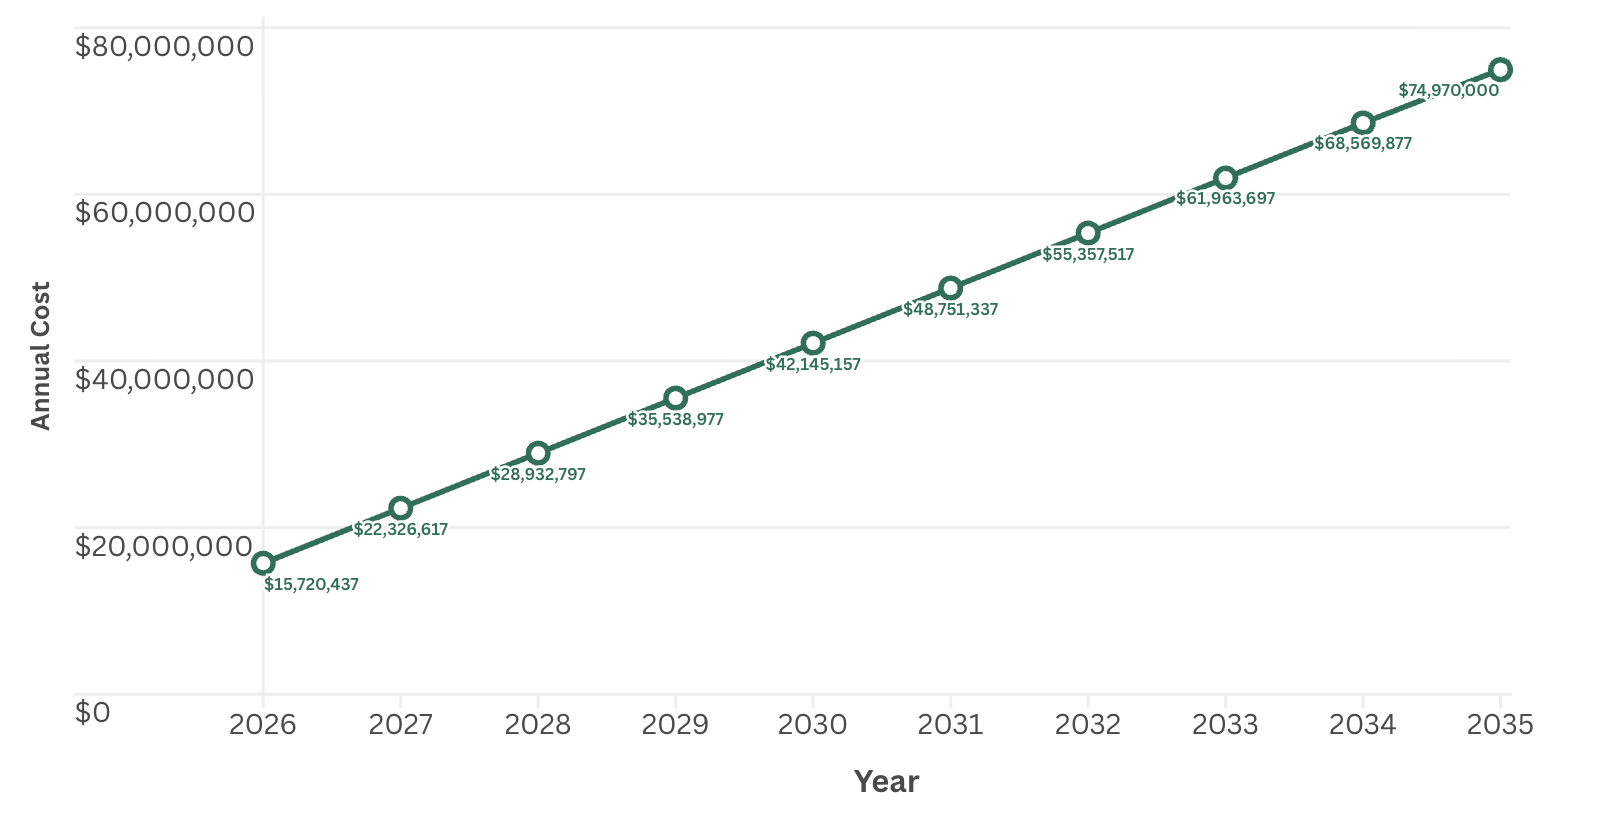
What would the annual direct cost of scaling to 17,000 high-quality paid internship placements look like from 2026 through 2035?
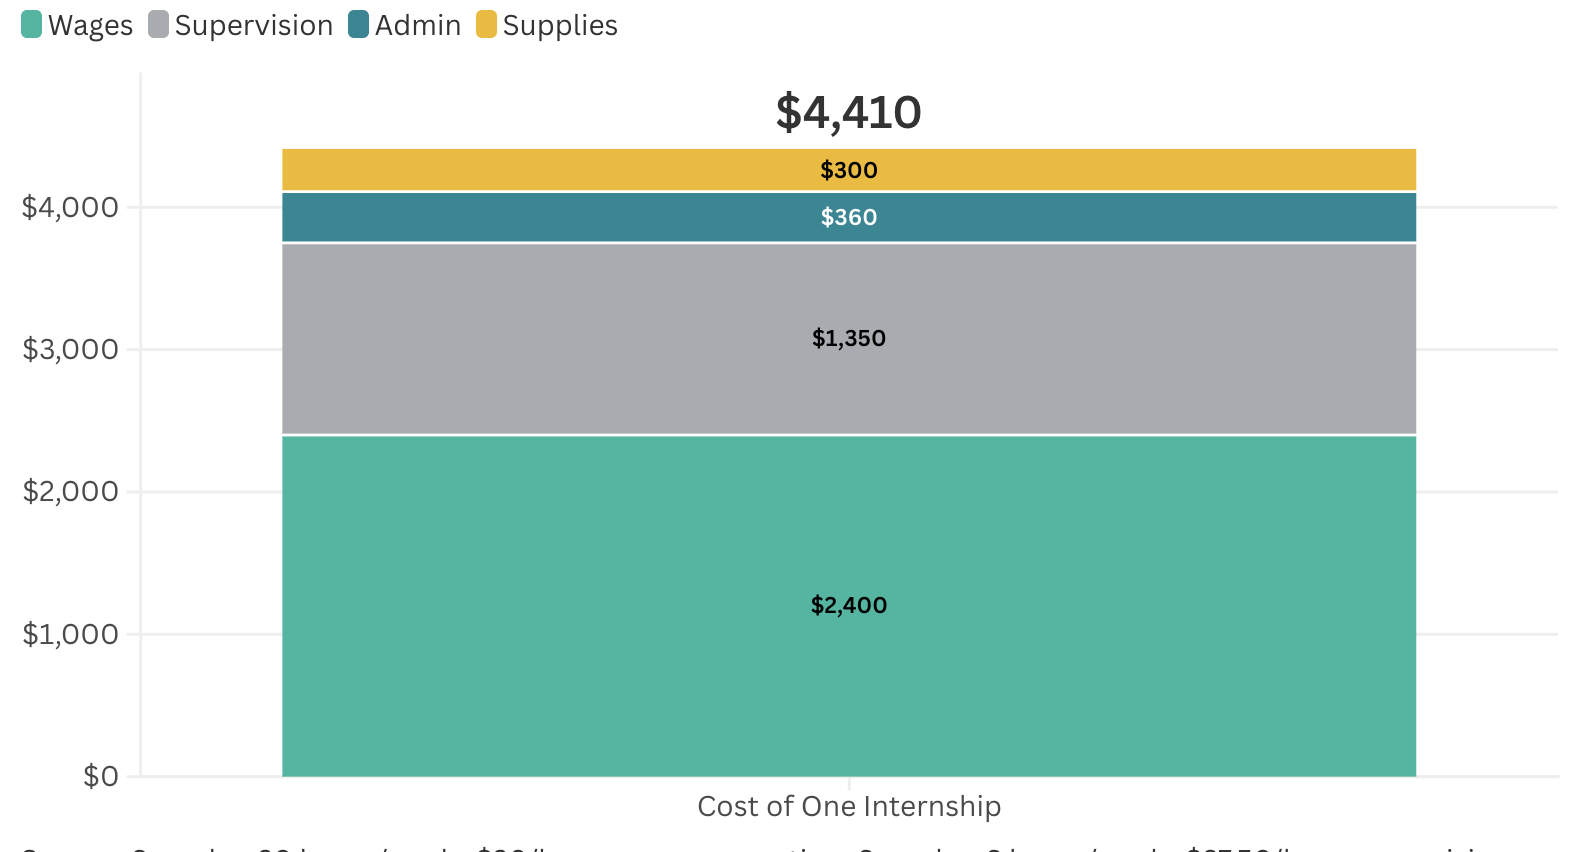
What does it cost to deliver one high-quality, six-week paid internship, and how is that cost distributed across wages and other supports?
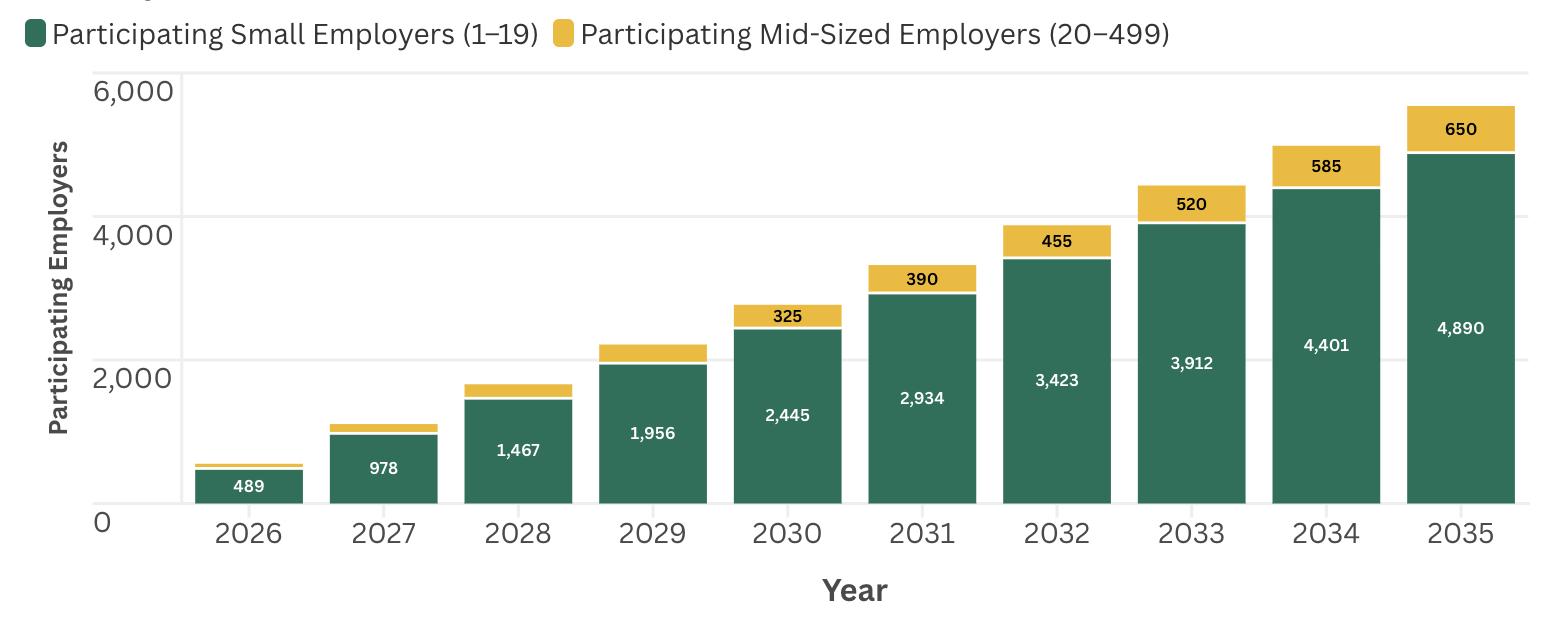
How many employers across different size categories would need to participate each year for Hawaiʻi to reach 17,000 annual paid pathway opportunities by 2035?
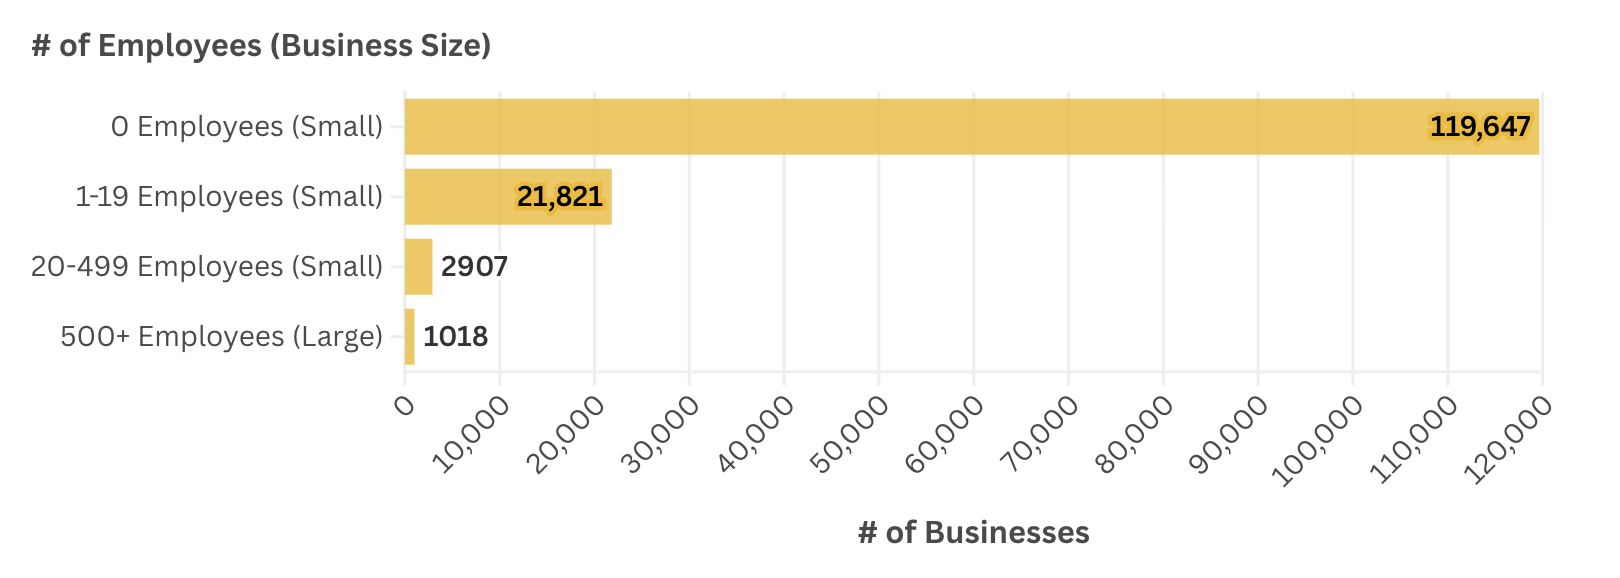
What is the size distribution of Hawaiʻi’s business and employer base, and what does it mean for the feasibility of expanding paid internship access?